 IoT
IoT IoT Data Visualization: Building a Real-Time Monitoring Dashboard with Grafana + InfluxDB
Why Do IoT Projects Need a Data Visualization Dashboard?
If you’ve worked on IoT projects, you’ve definitely run into this problem: you’ve collected tons of sensor data sitting in a database gathering dust, and when your boss or client asks “What’s the temperature right now? How’s the humidity trending?” you’re stuck digging through logs for half an hour.
Data that isn’t visualized is data that doesn’t exist.
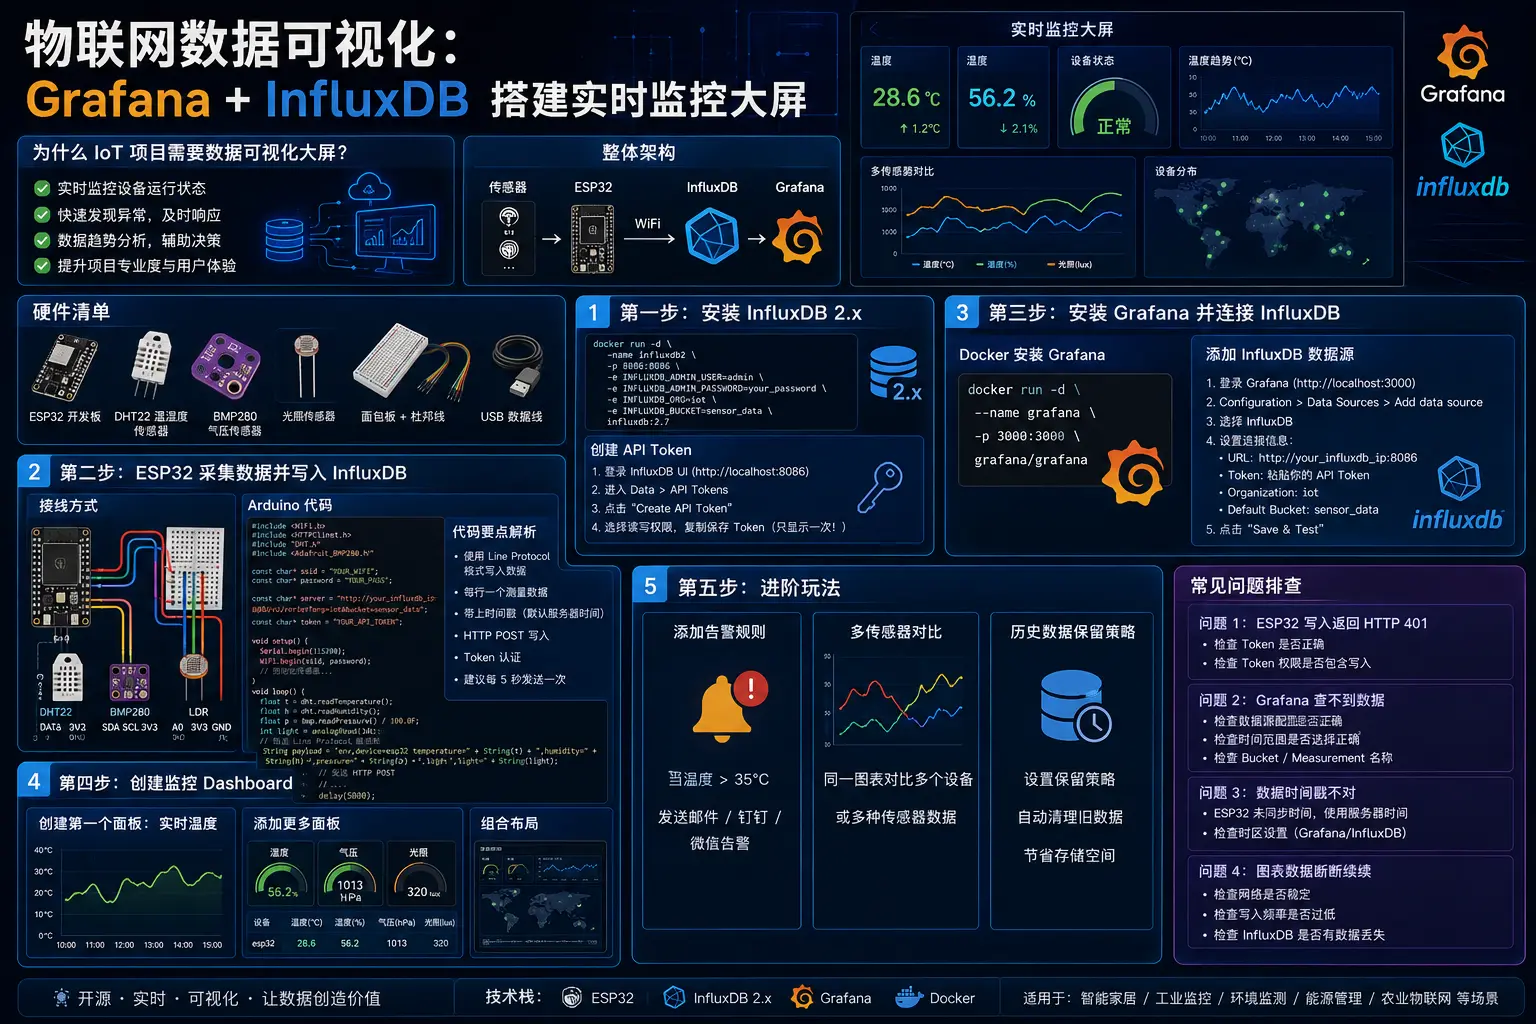
In this post, I’ll walk you through building a complete IoT data visualization system from scratch. We’ll use the golden combo of Grafana + InfluxDB — the ESP32 collects sensor data and writes it to InfluxDB over HTTP, then Grafana creates a slick real-time monitoring dashboard. The whole process requires zero frontend code — it’s all configuration.
Overall Architecture
ESP32 + BME280 Sensor
        │
        │  HTTP POST /api/v2/write
        ▼
   InfluxDB 2.x
   (Time-Series Database)
        │
        │  Query
        ▼
    Grafana 10.x
(Visualization Dashboard)- ESP32: The hardware side — reads temperature, humidity, and barometric pressure data and sends HTTP requests over WiFi to write to InfluxDB
- InfluxDB 2.x: A database purpose-built for time-series data — fast writes, high compression, a natural fit for sensor scenarios
- Grafana: An open-source visualization tool with a built-in InfluxDB plugin — drag and drop to generate charts
Hardware List
| Hardware | Quantity | Notes |
|---|---|---|
| ESP32 Dev Board (ESP32-WROOM-32) | 1 | Main controller with built-in WiFi |
| BME280 Sensor Module | 1 | Temperature + humidity + barometric pressure, 3-in-1, I2C interface |
| Dupont Wires (Female-to-Female) | 4 | For sensor connections |
| Breadboard | 1 | For prototyping |
Step 1: Install InfluxDB 2.x
Docker is the recommended deployment method — one command and you’re done:
docker run -d \
  --name influxdb2 \
  -p 8086:8086 \
  -v influxdb-storage:/var/lib/influxdb2 \
  -v influxdb-config:/etc/influxdb2 \
  -e DOCKER_INFLUXDB_INIT_MODE=setup \
  -e DOCKER_INFLUXDB_INIT_USERNAME=admin \
  -e DOCKER_INFLUXDB_INIT_PASSWORD=MakerOnsite2026 \
  -e DOCKER_INFLUXDB_INIT_ORG=makeronsite \
  -e DOCKER_INFLUXDB_INIT_BUCKET=iot-sensors \
  influxdb:2.7
Once it’s up and running, open http://localhost:8086 in your browser and log in with admin / MakerOnsite2026 to access the InfluxDB admin UI.
Create an API Token
After logging in, go to Load Data → API Tokens, click Generate API Token → Read/Write Token, and create a new read/write token. You’ll need this token later for both the ESP32 writes and Grafana reads.
⚠️ Note: The token is only displayed once after creation — be sure to copy and save it!
Step 2: ESP32 Data Collection and Writing to InfluxDB
We’ll develop the ESP32 using the Arduino framework, read BME280 sensor data over I2C, then POST the data to InfluxDB’s API via HTTP.
Wiring
| BME280 Pin | ESP32 Pin |
|---|---|
| VCC | 3.3V |
| GND | GND |
| SCL | GPIO 22 |
| SDA | GPIO 21 |
Arduino Code
#include <WiFi.h>
#include <HTTPClient.h>
#include <Wire.h>
#include <Adafruit_BME280.h>

// WiFi configuration
const char* ssid = "YourWiFiSSID";
const char* password = "YourWiFiPassword";

// InfluxDB configuration
const char* influxdb_url = "http://192.168.1.100:8086";
const char* org = "makeronsite";
const char* bucket = "iot-sensors";
const char* token = "your-api-token-here";

// BME280 sensor
#define SEALEVELPRESSURE_HPA 1013.25
Adafruit_BME280 bme;

// Data send interval (milliseconds)
const int SEND_INTERVAL = 10000;
unsigned long lastSend = 0;

void setup() {
  Serial.begin(115200);

  // Connect to WiFi
  WiFi.begin(ssid, password);
  Serial.print("Connecting to WiFi");
  while (WiFi.status() != WL_CONNECTED) {
    delay(500);
    Serial.print(".");
  }
  Serial.println("\nWiFi connected, IP: " + WiFi.localIP().toString());

  // Initialize BME280
  if (!bme.begin(0x76)) {
    Serial.println("BME280 sensor not found!");
    while (1) delay(100);
  }
  Serial.println("BME280 sensor initialized.");
}

void loop() {
  unsigned long now = millis();

  if (now - lastSend >= SEND_INTERVAL) {
    lastSend = now;
    sendToInfluxDB();
  }

  delay(100);
}

void sendToInfluxDB() {
  // Read sensor data
  float temperature = bme.readTemperature();
  float humidity = bme.readHumidity();
  float pressure = bme.readPressure() / 100.0F;

  if (isnan(temperature) || isnan(humidity)) {
    Serial.println("Failed to read sensor data!");
    return;
  }

  Serial.printf("Temp: %.2f°C | Humidity: %.2f%% | Pressure: %.2fhPa\n",
                temperature, humidity, pressure);

  // Build InfluxDB Line Protocol
  String lineProtocol = "bme280,location=living_room ";
  lineProtocol += "temperature=" + String(temperature) + ",";
  lineProtocol += "humidity=" + String(humidity) + ",";
  lineProtocol += "pressure=" + String(pressure);

  // Build InfluxDB v2 API URL
  String writeUrl = String(influxdb_url) + "/api/v2/write";
  writeUrl += "?org=" + String(org);
  writeUrl += "&bucket=" + String(bucket);
  writeUrl += "&precision=ms";

  HTTPClient http;
  http.begin(writeUrl);
  http.addHeader("Authorization", "Token " + String(token));
  http.addHeader("Content-Type", "text/plain; charset=utf-8");

  int httpResponseCode = http.POST(lineProtocol);

  if (httpResponseCode > 0) {
    Serial.printf("InfluxDB write success, HTTP code: %d\n", httpResponseCode);
  } else {
    Serial.printf("InfluxDB write failed, HTTP code: %d\n", httpResponseCode);
  }

  http.end();
}
Key Code Points
- Line Protocol: This is InfluxDB’s data format, structured as
measurement,tag_key=tag_value field_key=field_value timestampmeasurementis like a table name in SQL — here it’sbme280tagis an indexed field (e.g., location) used for fast filteringfieldis the actual numeric value (e.g., temperature, humidity)
- Precision Parameter:
precision=msmeans timestamps are in milliseconds - Token Authentication: InfluxDB 2.x requires an Authorization header on every request
💡 Tip: If your ESP32 is tight on memory, adjust
SEND_INTERVALto 30000 (30 seconds) or 60000 (1 minute) to reduce write frequency.
Step 3: Install Grafana and Connect to InfluxDB
Install Grafana with Docker
docker run -d \
  --name grafana \
  -p 3000:3000 \
  -v grafana-storage:/var/lib/grafana \
  grafana/grafana:10.4.0
Visit http://localhost:3000 — the default username and password are both admin. You’ll be prompted to change the password on first login.
Add InfluxDB as a Data Source
- In the left sidebar, click Connections → Data Sources
- Click Add data source, search for and select InfluxDB
- Key configuration:
| Setting | Value |
|---|---|
| Query Language | Flux |
| URL | http://192.168.1.100:8086 |
| Organization | makeronsite |
| Token | Your API Token |
| Default Bucket | iot-sensors |
- Click Save & Test — if you see “Data source is working”, the connection is successful!
Step 4: Create the Monitoring Dashboard
Create the First Panel: Real-Time Temperature
- Click Dashboards → Create Dashboard → Add visualization in the left sidebar
- Select the InfluxDB data source you just created
- Use the Flux query language in the Query Editor:
from(bucket: "iot-sensors")
  |> range(start: -1h)
  |> filter(fn: (r) => r["_measurement"] == "bme280")
  |> filter(fn: (r) => r["_field"] == "temperature")
  |> aggregateWindow(every: 1m, fn: mean, createEmpty: false)
|> yield(name: "mean")- On the right, set Panel type to Time series (time-series line chart)
- Set the Panel title to “Living Room Temperature”
- Adjust colors, units (°C), and axes
Add More Panels
Click Add → Visualization and use the same approach to add:
Humidity Panel:
from(bucket: "iot-sensors")
  |> range(start: -1h)
  |> filter(fn: (r) => r["_measurement"] == "bme280")
  |> filter(fn: (r) => r["_field"] == "humidity")
  |> aggregateWindow(every: 1m, fn: mean, createEmpty: false)
  |> yield(name: "mean")
Set Panel type to Gauge, unit to Percent (0-100), and color thresholds to 30%-70% green, everything else red.
Barometric Pressure Panel:
from(bucket: "iot-sensors")
  |> range(start: -1h)
  |> filter(fn: (r) => r["_measurement"] == "bme280")
  |> filter(fn: (r) => r["_field"] == "pressure")
  |> aggregateWindow(every: 1m, fn: mean, createEmpty: false)
  |> yield(name: "mean")
Set Panel type to Stat (single-value display), unit hPa.
Arrange the Layout
Grafana supports drag-and-drop resizing and positioning of panels. Suggested layout:
┌──────────────────────┬──────────────────────┐
│  Temperature Line    │  Humidity Gauge      │
│  Chart (wide)        │  (small)             │
├──────────────────────┴──────────────────────┤
│         Pressure Stat Display               │
└──────────────────────────────────────────────┘
Save the dashboard and name it IoT Sensors Dashboard.
Step 5: Advanced Techniques
Add Alert Rules
Grafana supports built-in alerting. Click a panel title → Alert → Create Alert Rule:
- Rule: Trigger when temperature > 35°C for 5 minutes
- Notification channels: Configure Email, Webhook, DingTalk, WeCom, etc.
Multi-Sensor Comparison
If you have multiple ESP32 nodes, use different location tags in the Line Protocol:
// Node 2 (outdoor)
String lineProtocol = "bme280,location=outdoor ";
lineProtocol += "temperature=" + String(temperature) + ",";
Then in Grafana, use the $location variable for filtering, or use this query to display multiple locations at once:
from(bucket: "iot-sensors")
  |> range(start: -1h)
  |> filter(fn: (r) => r["_measurement"] == "bme280")
  |> filter(fn: (r) => r["_field"] == "temperature")
  |> group(columns: ["location"])
  |> aggregateWindow(every: 5m, fn: mean, createEmpty: false)
Historical Data Retention Policy
By default, InfluxDB keeps data forever, which can consume significant disk space in high-frequency collection scenarios. You can create a Retention Policy:
# Create a 90-day auto-cleanup policy via InfluxDB CLI
influx v1 dbrp create \
  --bucket-id your-bucket-id \
  --db iot-sensors \
  --rp 90d \
  --default
Troubleshooting Common Issues
Issue 1: ESP32 Write Returns HTTP 401
Cause: Token is incorrect or expired.
Troubleshooting:
# Test if the token is valid
curl -s http://192.168.1.100:8086/api/v2/buckets \
  -H "Authorization: Token YOUR_TOKEN"
If it returns 401, regenerate the token and update the ESP32 code.
Issue 2: Grafana Can’t Find Data
Cause: Bucket name mismatch or query error.
Troubleshooting:
- Run the query manually in InfluxDB’s Data Explorer in the Web UI to confirm data has been written
- Check that the Bucket name in Grafana’s data source matches the one in InfluxDB
- Make sure the
_measurementname in the query matches the one in the Line Protocol
Issue 3: Data Timestamps Are Wrong
Cause: The ESP32 doesn’t have NTP time sync, so written timestamps are inaccurate.
Solution: Don’t send a timestamp — let InfluxDB use the server’s time:
// Don't append a timestamp — InfluxDB will automatically use the server's write time
String lineProtocol = "bme280,location=living_room ";
lineProtocol += "temperature=" + String(temperature) + ",";
// Remove the precision=ms parameter from the URL
Issue 4: Chart Data Is Spotty
Cause: Unstable ESP32 WiFi connection or send interval too long.
Troubleshooting:
- Check the Serial Monitor for the frequency of
InfluxDB write successlog messages - Check network latency between the ESP32 and the InfluxDB server
- Consider adding a data buffer on the ESP32 side to resend data once the network recovers
Summary
Today we built a complete IoT data visualization solution:
- InfluxDB efficiently stores sensor time-series data, with write speeds easily reaching tens of thousands of writes per second
- Grafana generates beautiful monitoring dashboards with zero-code drag-and-drop
- ESP32 + BME280 provides real-time environmental data collection
The advantages of this approach:
- Low cost: All open-source software, hardware cost under $7 USD
- Scalable: Easily connect dozens or even hundreds of sensor nodes
- Real-time: Less than 10 seconds from data collection to display
- Zero frontend: No HTML/CSS/JS needed — configuration only
Next, you could try connecting an MQTT Broker (such as EMQX) to pipe data through MQTT → Telegraf → InfluxDB, creating a more standardized IoT data pipeline.
Happy Making! 🔧