 Embedded Development
 TinyML Anomaly Detection: Edge-Based Predictive Maintenance for Industrial Equipment
A motor breaks down on the factory floor, and the entire production line grinds to a halt. By the time the maintenance technician arrives, hours of output have already been lost. The core idea behind predictive maintenance is to catch anomalies in vibration, sound, temperature, and other signals before equipment fails completely. TinyML makes all of this possible on a microcontroller that costs just a few dozen dollars — no cloud required, no expensive industrial controllers needed.
What Is TinyML Anomaly Detection?
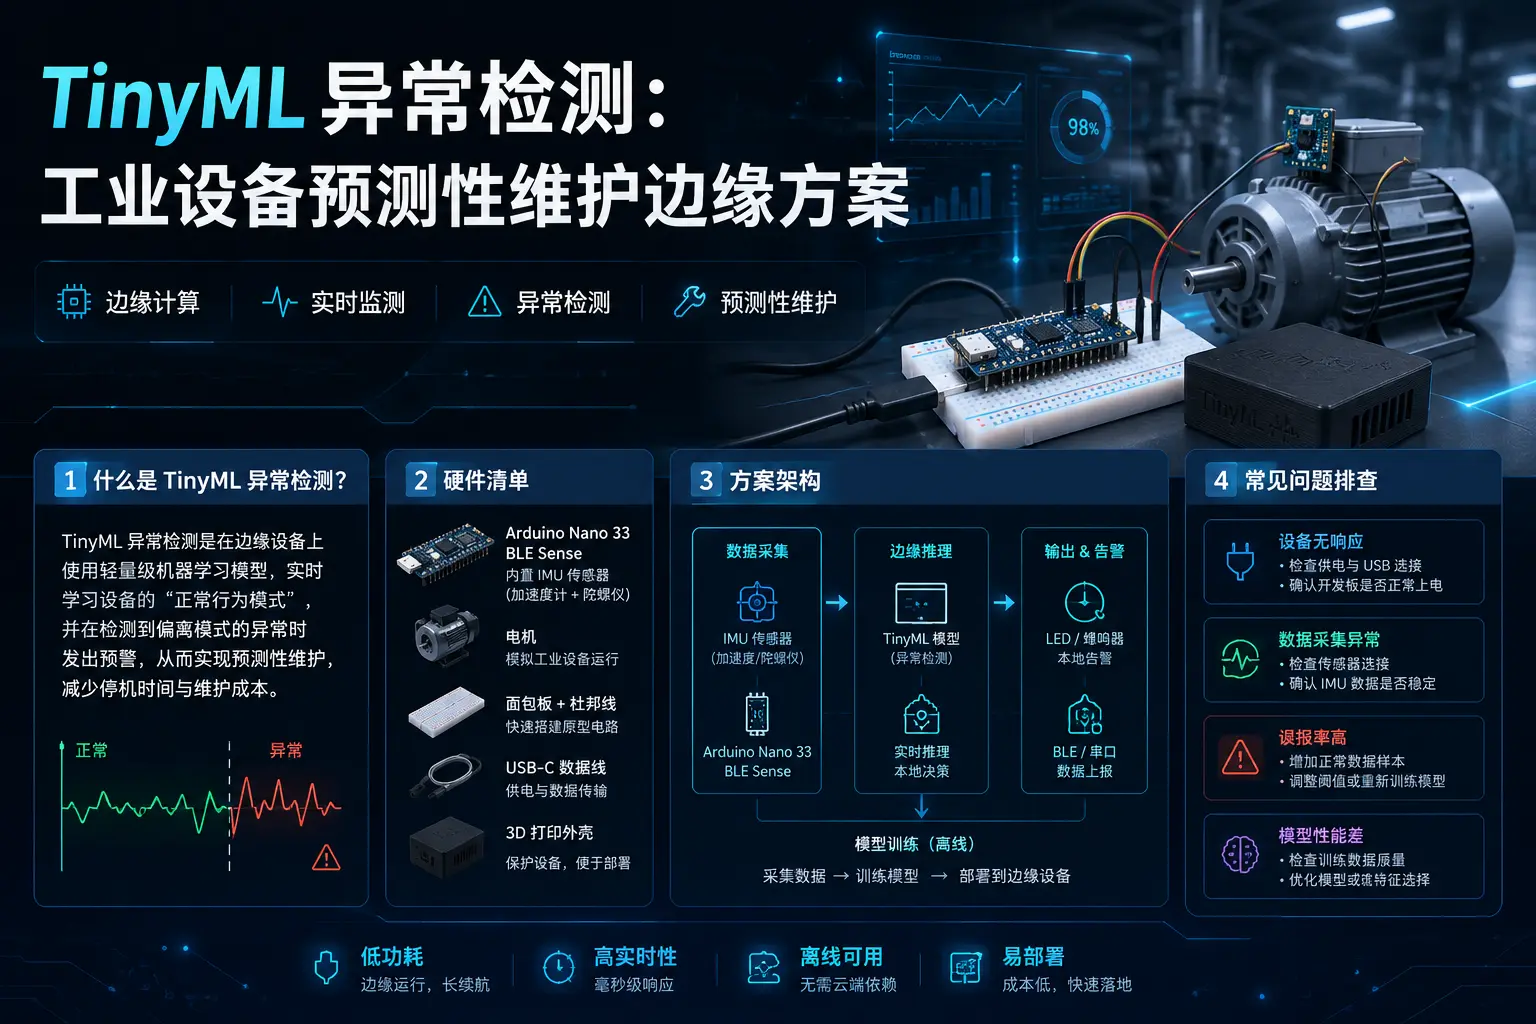
TinyML stands for “Tiny Machine Learning” — it refers to shrinking machine learning models so they can run on microcontrollers with less than 256 KB of memory. Traditional anomaly detection solutions typically send sensor data to a server for analysis, which means high latency, large bandwidth costs, and complete failure in offline scenarios.
TinyML anomaly detection takes the opposite approach: the model is flashed directly onto the MCU, sensor data is inferred locally, and only anomalies are reported upstream. The entire process can achieve latency under 10 ms, consumes just a few milliwatts of power, and can run for months on a battery.
Typical industrial application scenarios include:
- Motor bearing wear detection: Capturing changes in vibration spectrum via an accelerometer to identify early-stage bearing wear
- Pump cavitation early warning: Bubble collapse inside liquid pumps produces abnormal vibrations — anomaly detection models can distinguish normal fluctuations from cavitation signatures
- Wind turbine blade faults: When wind turbine blades develop cracks or icing, their vibration patterns change
- Conveyor belt misalignment detection: Determining whether a conveyor belt has drifted off track through vibration frequency shifts
Bill of Materials
| Component | Model | Price Reference | Notes |
|---|---|---|---|
| Dev board | Arduino Nano 33 BLE Sense | ¥180 | Built-in LSM9DS1 IMU (accelerometer + gyroscope), no external sensors needed |
| Motor | Small DC motor + fan blade | ¥20 | Test subject; an old hard drive motor works as a substitute |
| Breadboard + jumper wires | Assorted | ¥10 | For prototyping |
| USB-C data cable | 1 pcs | ¥10 | For power and flashing firmware |
| 3D-printed enclosure (optional) | DIY | ¥15 | For mounting the sensor to the motor housing |
Total cost is under ¥250 to build a complete vibration anomaly detection prototype. If your factory already has sensors on hand (e.g., ADXL345, MPU6050), you can swap out the LSM9DS1 with minor code adjustments.
Solution Architecture
┌─────────────────┐     ┌──────────────────┐     ┌──────────────┐
│  Accelerometer  │────>│ Arduino Nano 33  │────>│ Anomaly       │
│  (LSM9DS1)      │     │ BLE Sense        │     │ Decision      │
│                 │     │                  │     │ LED / Serial  │
└─────────────────┘     └──────────────────┘     └──────────────┘
        │                         │                      │
   Vibration data            Model inference         Normal: Green LED
                             (<20KB RAM)             Anomaly: Red LED + alert
The entire pipeline requires no cloud involvement. If you need remote monitoring, you can add an ESP32 as a WiFi/MQTT relay to push notifications when anomalies are detected.
Step 1: Collecting Training Data
Anomaly detection is a form of unsupervised learning — you only need to collect data from the equipment’s “normal state,” and the model will learn what normal looks like. Any deviation from the normal pattern will then trigger an alert.
Data Collection Guidelines
- Sampling rate: The LSM9DS1 supports up to 952 Hz; for motor vibration, at least 200 Hz is recommended
- Duration: Each normal-state sample should be at least 10 seconds, with 60 seconds or more preferred
- Cover operating conditions: Collect data at different speeds, loads, and temperatures
- Mounting position: The accelerometer must be pressed firmly against the motor housing — loose mounting introduces extra noise
Data Collection Code
Connect the Nano 33 BLE Sense to your computer via USB, install the Arduino_LSM9DS1 library, and flash the following code:
#include <Arduino_LSM9DS1.h>

#define SAMPLE_RATE_HZ 200
#define SAMPLE_INTERVAL_MS (1000 / SAMPLE_RATE_HZ)

void setup() {
  Serial.begin(115200);

  if (!IMU.begin()) {
    Serial.println("IMU initialization failed!");
    while (1);
  }

  // Set accelerometer range to ±4g
  IMU.setAccelerometerRange(4);
  // Set sampling mode
  IMU.setContinuousMode();

  Serial.println("Collecting data, format: ax,ay,az");
}

void loop() {
  float ax, ay, az;

  if (IMU.accelerationAvailable()) {
    IMU.readAcceleration(ax, ay, az);
    Serial.print(ax, 6);
    Serial.print(",");
    Serial.print(ay, 6);
    Serial.print(",");
    Serial.println(az, 6);
  }

  delay(SAMPLE_INTERVAL_MS);
}
After running, use the Serial Monitor to collect data in CSV format. It’s recommended to collect 5–10 files per operating condition, named like normal_motor_600rpm_1.csv, normal_motor_600rpm_2.csv, and so on.
Step 2: Training the Model on Edge Impulse
Edge Impulse is currently the most convenient TinyML development platform — it supports browser-based operation, automatic feature extraction, and one-click Arduino library export.
2.1 Create a Project and Upload Data
- Register an Edge Impulse account and create a new project
- Go to Data acquisition → Upload existing data
- Upload all collected CSV files
- Make sure all data is labeled as the
normalclass (unsupervised anomaly detection only needs normal data)
2.2 Configure Signal Processing
Go to Create impulse and set:
- Window size: 2000ms (2-second window, covering enough vibration cycles)
- Window increase: 1000ms (50% overlap to improve detection sensitivity)
- DSP blocks: Add “Spectral Analysis” and “Statistical features”
For vibration signals, spectral analysis is critical. Edge Impulse automatically computes the FFT and extracts features such as dominant frequencies, harmonics, and frequency-band energy.
2.3 Train the Anomaly Detection Model
Add an Anomaly Detection learning block:
DSP Block (Spectral Analysis + Statistical Features)
        ↓
Neural Network / k-NN Anomaly Detection
        ↓
Anomaly Score (0~1)- For model type, choose k-NN Anomaly (suitable for small datasets) or Neural Network Autoencoder (better performance with larger datasets)
- k-NN requires only a few dozen KB of memory; Neural Network uses about 100–200 KB
- After training, check the Model performance page
Key metrics:
- Anomaly threshold: Default is 0.5; adjust based on real-world testing
- Confusion matrix: The false positive rate on normal data should be below 5%
2.4 Validate the Model
Use the Live classification feature — connect the board to your computer and watch the model output in real time. During normal motor operation, the anomaly score should stay steady between 0.1–0.3. Then gently tap the motor housing or add a load to the motor and observe whether the score spikes above 0.8 — if the separation is clear, the model is working.
Step 3: Deploy to Arduino
After training is complete, go to Deployment on Edge Impulse → Arduino Library, and download the .zip package. Then in the Arduino IDE, import it via “Sketch → Include Library → Add .ZIP Library”.
Complete Deployment Code
// Include the library generated by Edge Impulse
#include <anomaly_detection_inferencing.h>
#include <Arduino_LSM9DS1.h>

#define SAMPLE_INTERVAL_MS 5
#define WINDOW_SIZE_MS 2000
#define ANOMALY_THRESHOLD 0.5

// Global buffer
static const size_t feature_size = EI_CLASSIFIER_DSP_INPUT_FRAME_SIZE;
static float features[feature_size];
static size_t feature_idx = 0;

// LED indicators
const int LED_GREEN = LED_BUILTIN;
const int LED_RED = LED_BUILTIN2;  // Some boards have a second LED

void setup() {
  Serial.begin(115200);

  pinMode(LED_GREEN, OUTPUT);
  pinMode(LED_RED, OUTPUT);

  // Initialize IMU
  if (!IMU.begin()) {
    Serial.println("IMU initialization failed");
    digitalWrite(LED_RED, HIGH);
    while (1);
  }

  IMU.setAccelerometerRange(4);
  IMU.setContinuousMode();

  Serial.println("TinyML Anomaly Detection System Started");
  Serial.printf("Window size: %dms, Threshold: %.2f\n", WINDOW_SIZE_MS, ANOMALY_THRESHOLD);
}

void loop() {
  float ax, ay, az;

  // Collect accelerometer data
  if (IMU.accelerationAvailable()) {
    IMU.readAcceleration(ax, ay, az);

    // Fill the feature buffer (three-axis data interleaved)
    features[feature_idx * 3 + 0] = ax;
    features[feature_idx * 3 + 1] = ay;
    features[feature_idx * 3 + 2] = az;
    feature_idx++;

    // Window is full — run inference
    if (feature_idx >= (WINDOW_SIZE_MS / SAMPLE_INTERVAL_MS)) {
      run_inference();
      feature_idx = 0;
    }
  }

  delay(SAMPLE_INTERVAL_MS);
}

void run_inference() {
  // Construct signal_t
  signal_t signal;
  int err = numpy::signal_from_buffer(features, feature_size, &signal);
  if (err != 0) {
    Serial.println("Signal buffer error");
    return;
  }

  // Run inference
  ei_impulse_result_t result = {0};
  err = run_classifier(&signal, &result, false);
  if (err != 0) {
    Serial.printf("Inference error: %d\n", err);
    return;
  }

  // Read anomaly score
  float anomaly_score = result.anomaly;

  Serial.printf("Anomaly score: %.3f\n", anomaly_score);

  if (anomaly_score > ANOMALY_THRESHOLD) {
    // Anomaly! Turn on red LED
    digitalWrite(LED_GREEN, LOW);
    digitalWrite(LED_RED, HIGH);
    Serial.println("⚠️ Anomaly detected! Check equipment status");
  } else {
    // Normal: turn on green LED
    digitalWrite(LED_GREEN, HIGH);
    digitalWrite(LED_RED, LOW);
    Serial.println("✓ Equipment operating normally");
  }
}
Code Explanation
- Sampling interval of 5 ms (200 Hz), 2000 ms window = 400 samples × 3 axes = 1,200 feature values
- Each time the window fills up,
run_classifier()is called for inference - When the anomaly score exceeds the threshold, the red LED turns on and an alert is sent via serial
- Inference takes approximately 10–20 ms, fully meeting real-time requirements
Step 4: Remote Monitoring Extension (Optional)
A standalone LED alert is just the starting point — industrial scenarios typically require remote notifications. The simplest approach is to use an ESP32 as a WiFi relay, pushing messages via MQTT when anomalies occur:
// Add to the anomaly branch inside run_inference()
if (anomaly_score > ANOMALY_THRESHOLD) {
  // Send to ESP32 via serial
  Serial.println("ANOMALY_DETECTED");

  // Or go directly over WiFi (if using the Nano 33 BLE Sense)
  // Send an HTTP POST to your backend API
}
The ESP32 side receives serial data and publishes via MQTT:
#include <WiFi.h>
#include <PubSubClient.h>

WiFiClient espClient;
PubSubClient mqtt(espClient);

void check_anomaly() {
  if (Serial.available() > 0) {
    String msg = Serial.readStringUntil('\n');
    if (msg == "ANOMALY_DETECTED") {
      mqtt.publish("factory/motor001/anomaly", "DETECTED");
      Serial.println("Anomaly notification sent");
    }
  }
}
Common Troubleshooting
Q1: Model has too many false positives
Cause: Training data lacks diversity, or the threshold is set too low.
Troubleshooting steps:
- Check whether the training data covers all normal operating conditions (different speeds, temperatures, loads)
- Observe the score distribution during normal operation using Edge Impulse’s Live classification
- Raise the threshold from 0.5 to 0.6–0.7 and observe changes in the false positive rate
- Increase the amount of training data — at least 30 minutes of normal-state data
Q2: Model fails to detect real anomalies
Cause: Anomaly signatures are too subtle, or the window size is inappropriate.
Troubleshooting steps:
- Try increasing the window size (e.g., from 2000 ms to 4000 ms) to capture more cycle information
- Check whether the sensor is mounted loosely — loose mounting generates a lot of spurious signals
- Try switching DSP blocks — add “Raw data” features instead of relying solely on spectral data
- Consider introducing known anomaly data for supervised learning, which often yields better results
Q3: Inference is too slow
Cause: Model is too large or the MCU clock speed is insufficient.
Troubleshooting steps:
- Check model RAM/Flash usage on the Edge Impulse deployment page — ensure the Nano 33 BLE Sense’s 256 KB RAM is sufficient
- Try a k-NN model instead of a Neural Network — memory usage drops by roughly 60%
- Select the “EON Compiler” optimization option during deployment for a 20–30% inference speed boost
- Lower the sampling rate (200 Hz → 100 Hz) — if anomaly frequency features are below 50 Hz, 100 Hz sampling is sufficient
Q4: Accelerometer readings are unstable
Cause: Power supply ripple, poor soldering, or I2C/SPI communication interference.
Troubleshooting steps:
- Use a multimeter to check that the 3.3V supply voltage is stable (fluctuation should be < 50 mV)
- If using an external sensor, check the I2C pull-up resistors (4.7 kΩ is the standard value)
- Add software filtering in code:
ax = ax * 0.8 + last_ax * 0.2(first-order low-pass filter) - Verify the accelerometer range setting is correct — 4g range suits most industrial vibration scenarios
Performance & Cost Comparison
| Approach | Latency | Monthly Cost | Works Offline | Dev Difficulty |
|---|---|---|---|---|
| Cloud ML (AWS IoT) | 1–5 seconds | ¥500+ | ❌ | Medium |
| Raspberry Pi + TensorFlow | 100–500 ms | ¥300+ | ✅ | Medium |
| TinyML (this approach) | 10–20 ms | ¥0 | ✅ | Low |
For industrial scenarios requiring millisecond-level response (e.g., emergency shutdown protection), TinyML is the only solution that simultaneously delivers low latency and low cost.
Advanced Directions
- Continuous Learning: Edge Impulse supports continuous learning with the FOMO architecture, allowing models to be updated online to adapt to baseline drift caused by equipment aging
- Multi-sensor fusion: Simultaneously collecting vibration, sound, and temperature data can improve fusion model accuracy by 20%+
- Transfer learning: Fine-tune a model trained on one device to adapt it to another similar device, drastically reducing data collection effort
- Production-grade deployment: Use PlatformIO for project management, OTA for remote model updates, and watchdog timers to ensure system reliability
Predictive maintenance is one of the cornerstones of Industry 4.0. As the TinyML ecosystem matures, what once required a specialized team can now be accomplished by a single engineer with a development board. Next time something on the factory floor “doesn’t feel quite right,” TinyML might have already told you three days in advance.