 OpenCV
 Complete Guide to OpenCV Python Drawing: Lines, Circles, Rectangles, Ellipses, Polygons, and Text
Introduction
In computer vision projects, drawing is one of the most fundamental and indispensable skills. Whether you’re annotating object detection results, drawing regions of interest (ROI), visualizing feature points, or overlaying debug information on images, you can’t do without OpenCV’s 2D drawing functions.
Many beginners learning OpenCV face a common dilemma: the information they find is scattered across different articles, each covering only a single function, lacking a holistic perspective and making it hard to build a complete knowledge system. This guide aims to solve that problem by consolidating all commonly used 2D drawing functions in OpenCV Python and explaining them systematically one by one.
Starting from cv.line, this article covers cv.rectangle, cv.circle, cv.ellipse, cv.polylines, cv.fillConvexPoly, cv.arrowedLine, cv.drawMarker, cv.putText, and a complete solution for rendering Chinese text using PIL. Each function comes with fully runnable code examples, detailed parameter explanations, and practical usage tips. At the end, you’ll find a comprehensive combined example, a parameter quick-reference table, and a FAQ section to help you master OpenCV 2D drawing in one read.
This guide uses OpenCV version 4.1.1+ and runs in a Jupyter Notebook environment.
Environment Setup
Before we start drawing, we need to import the necessary libraries and load a sample image as our drawing “canvas.”
import cv2
import numpy as np
import matplotlib.pyplot as plt

# Load the sample image
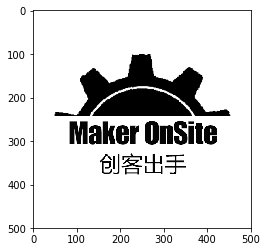
img = cv2.imread('MakerOnsite-Logo.png')

# Display the image using matplotlib
plt.imshow(img)
plt.axis('off')  # Hide axes
plt.show()Tip: In Jupyter Notebook,
plt.imshow()displays images inline. Note thatcv2.imread()loads images in BGR format, whilematplotlibdisplays them in RGB by default, so colors may appear off. If colors look wrong, convert before displaying:plt.imshow(cv2.cvtColor(img, cv2.COLOR_BGR2RGB)). This is especially important when drawing, since OpenCV’s drawing functions also expect colors in BGR order.
cv.line — Drawing Lines
cv.line is the most basic drawing function, used to draw a straight line segment from one point to another on an image. It’s commonly used for annotating directions, drawing grid lines, and rendering coordinate axes.
Function Syntax
img = cv.line(img, pt1, pt2, color[, thickness[, lineType[, shift]]])Parameters
| Parameter | Description |
|---|---|
img | Input image (modified in-place) |
pt1 | Starting point coordinates (x, y) |
pt2 | Ending point coordinates (x, y) |
color | Line color in BGR format, e.g., (0, 0, 255) for red |
thickness | (Optional) Line thickness, default is 1 |
lineType | (Optional) Line type, see the lineType section below |
shift | (Optional) Fractional shift factor for coordinate values |
Code Example
import cv2
import matplotlib.pyplot as plt

img = cv2.imread('MakerOnsite-Logo.png')

# Draw a red line from (50, 50) to (450, 450) with thickness 5
img = cv2.line(img, (50, 50), (450, 450), (0, 0, 255), 5)

plt.imshow(img)
plt.axis('off')
plt.show()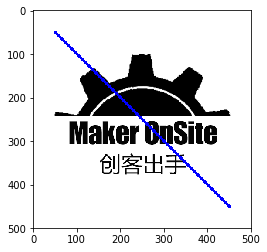
Note: All drawing functions in OpenCV modify the image in-place, meaning they directly modify the passed
imgobject and also return the modified image. So the assignment inimg = cv.line(img, ...)is technically redundant, but including it doesn’t hurt and makes the code’s intent clearer.
cv.rectangle — Drawing Rectangles
Rectangles are the most widely used shape in object detection — every bounding box is essentially a rectangle. cv.rectangle draws a rectangle by specifying two diagonal vertices.
Function Syntax
img = cv.rectangle(img, pt1, pt2, color[, thickness[, lineType[, shift]]])Parameters
| Parameter | Description |
|---|---|
img | Input image |
pt1 | Top-left corner coordinates (x, y) of the rectangle |
pt2 | Bottom-right corner coordinates (x, y) of the rectangle |
color | Line color in BGR format |
thickness | (Optional) Line thickness. When thickness = -1, a filled rectangle is drawn |
lineType | (Optional) Line type |
shift | (Optional) Coordinate shift factor |
Code Example
import cv2
import matplotlib.pyplot as plt

img = cv2.imread('MakerOnsite-Logo.png')

# Draw a gray border rectangle from (50, 50) to (450, 450) with thickness 5
img = cv2.rectangle(img, (50, 50), (450, 450), (100, 100, 100), 5)

plt.imshow(img)
plt.axis('off')
plt.show()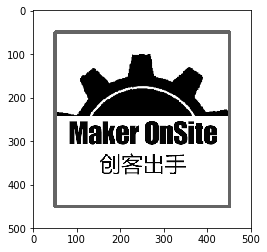
Practical Tip: If you need to draw a solid-filled rectangle (e.g., for adding a semi-transparent overlay to an image), set
thicknessto-1. This is very useful for annotating mask regions and creating heatmap overlays.
cv.circle — Drawing Circles
Drawing circles, dots, and marking key points are among the most common operations in OpenCV drawing. cv.circle can draw circles of various sizes, from a single pixel to large rings.
Function Syntax
img = cv.circle(img, center, radius, color[, thickness[, lineType[, shift]]])Parameters
| Parameter | Description |
|---|---|
img | Input image |
center | Center coordinates (x, y) |
radius | Radius of the circle |
color | Color in BGR format |
thickness | (Optional) Outline thickness. When thickness = -1, a filled circle is drawn |
lineType | (Optional) Circle boundary type |
shift | (Optional) Coordinate shift factor |
Code Example
import cv2
import matplotlib.pyplot as plt

img = cv2.imread('MakerOnsite-Logo.png')

# Draw a circle with center (50, 50), radius 20, orange border, thickness 5
img = cv2.circle(img, (50, 50), 20, (0, 101, 255), 5)

plt.imshow(img)
plt.axis('off')
plt.show()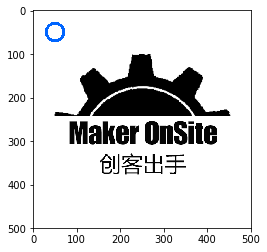
Dot Drawing Tip: If you just want to mark a point (e.g., keypoint detection results), set
radius=1orradius=2withthickness=-1to get a small solid dot. This is very common when annotating facial landmarks or corner detection results.
cv.ellipse — Drawing Ellipses
Ellipses add an extra dimension compared to circles — they have two axes (major and minor) and can be rotated. This makes ellipses very practical for annotating tilted objects and drawing rotated bounding boxes.
Function Syntax
OpenCV provides two ways to draw ellipses:
# Method 1: Specify center, axis lengths, rotation angle, and arc range
img = cv.ellipse(img, center, axes, angle, startAngle, endAngle, color[, thickness[, lineType[, shift]]])

# Method 2: Specify a rotated rectangle box
img = cv.ellipse(img, box, color[, thickness[, lineType]])
Parameters
| Parameter | Description |
|---|---|
img | Input image |
center | Ellipse center coordinates (x, y) |
axes | Ellipse axis lengths (halfWidth, halfHeight) — note these are half-axis lengths |
angle | Ellipse rotation angle (clockwise, in degrees) |
startAngle | Starting angle of the elliptic arc (in degrees) |
endAngle | Ending angle of the elliptic arc (in degrees) |
color | Color in BGR format |
thickness | (Optional) Outline thickness, -1 for filled |
lineType | (Optional) Boundary type |
shift | (Optional) Coordinate shift factor |
Code Example
import cv2
import matplotlib.pyplot as plt

img = cv2.imread('MakerOnsite-Logo.png')

# Draw an ellipse: center (250, 100), half-axes (20, 50), rotated 35 degrees, full arc (0 to 360)
img = cv2.ellipse(img, (250, 100), (20, 50), 35, 0, 360, (0, 200, 200), 10)

plt.imshow(img)
plt.axis('off')
plt.show()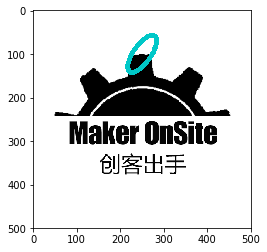
Arc Drawing Tip: By adjusting
startAngleandendAngle, you can draw only a portion of the ellipse. For example,startAngle=0, endAngle=180draws only half of the ellipse. This is useful for creating gauge dials, progress rings, and other visual effects.
cv.polylines — Drawing Polygons
When you need to draw irregular shapes (e.g., annotating segmentation regions or drawing arbitrarily shaped ROIs), cv.polylines is your go-to function. It takes an array of vertex coordinates and connects them sequentially with line segments.
Function Syntax
img = cv.polylines(img, pts, isClosed, color[, thickness[, lineType[, shift]]])Parameters
| Parameter | Description |
|---|---|
img | Input image |
pts | Polygon vertex coordinate array, must be a numpy array of type int32 |
isClosed | Whether to close the polygon. When True, the last vertex is automatically connected back to the first |
color | Color in BGR format |
thickness | (Optional) Line thickness |
lineType | (Optional) Line type |
shift | (Optional) Coordinate shift factor |
Code Example
import cv2
import numpy as np
import matplotlib.pyplot as plt

img = cv2.imread('MakerOnsite-Logo.png')

# Define polygon vertex coordinates
points = np.array([[50, 50], [50, 400], [400, 400], [450, 150], [350, 50]])

# Draw the polygon (closed), red color, thickness 5
# Note: the vertex array needs to be int32 type
img = cv2.polylines(img, np.int32([points]), 1, (100, 100, 255), 5)

plt.imshow(img)
plt.axis('off')
plt.show()
Important Reminder: The
ptsparameter requiresint32data type, while arrays created directly withnp.array()may default toint64. Although some versions won’t raise an error without conversion, it’s recommended to always explicitly convert usingnp.int32()orastype(np.int32)for compatibility. Also pay attention to array dimensions —ptsshould be a 3D array with shape(N, 1, 2), or wrap it withnp.int32([points]).
cv.fillConvexPoly — Filling Convex Polygons
If you need not just to draw a polygon outline but also to fill it with color, cv.fillConvexPoly is the answer. Note that this function only supports convex polygons — if you pass a concave polygon, the fill result will be incorrect. For concave polygons, use cv.fillPoly instead (not covered here; refer to the OpenCV official documentation).
Difference from cv.polylines
| Comparison | cv.polylines | cv.fillConvexPoly |
|---|---|---|
| Function | Draw polygon outline | Fill convex polygon interior |
| Filled? | No (outline only) | Yes (fills entire area) |
| Supports concave polygons? | Yes | No (convex only) |
Requires isClosed? | Yes | No (auto-closed) |
thickness parameter | Yes | No |
Function Syntax
img = cv.fillConvexPoly(img, points, color[, lineType[, shift]])Parameters
| Parameter | Description |
|---|---|
img | Input image |
points | Polygon vertex coordinate array |
color | Fill color in BGR format |
lineType | (Optional) Boundary type |
shift | (Optional) Coordinate shift factor |
Code Example
import cv2
import numpy as np
import matplotlib.pyplot as plt

img = cv2.imread('MakerOnsite-Logo.png')

# Define convex polygon vertices
points = np.array([[100, 50], [150, 400], [400, 400], [450, 150], [350, 50]])

# Fill the convex polygon
img = cv2.fillConvexPoly(img, points, (100, 100, 100))

plt.imshow(img)
plt.axis('off')
plt.show()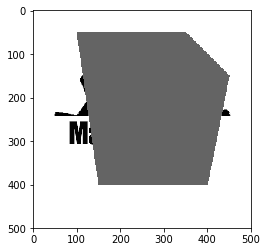
cv.arrowedLine — Drawing Arrowed Lines
Arrowed lines are very useful for annotating directions, drawing vector fields, and labeling optical flow. They are essentially line segments with an arrow at the end, and the arrow size can be controlled via the tipLength parameter.
Function Syntax
img = cv.arrowedLine(img, pt1, pt2, color[, thickness[, line_type[, shift[, tipLength]]]])Parameters
| Parameter | Description |
|---|---|
img | Input image |
pt1 | Starting point coordinates (x, y) |
pt2 | Ending point coordinates (x, y) (the arrow points here) |
color | Color in BGR format |
thickness | (Optional) Line thickness |
line_type | (Optional) Line type |
shift | (Optional) Coordinate shift factor |
tipLength | (Optional) Ratio of arrow tip length to total line length, default is approximately 0.1 |
Code Example
import cv2
import matplotlib.pyplot as plt

img = cv2.imread('MakerOnsite-Logo.png')

# Draw a red arrowed line from (50, 50) to (100, 100)
# tipLength=0.3 means the arrow tip takes up 30% of the total line length
img = cv2.arrowedLine(img, (50, 50), (100, 100), (0, 0, 255), 5, 8, 0, 0.3)

plt.imshow(img)
plt.axis('off')
plt.show()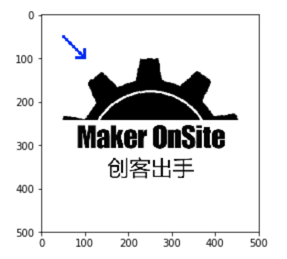
Practical Suggestion: The default value of
tipLengthis relatively small and the arrow may be barely visible on short line segments. If your lines are short (e.g., only a few dozen pixels long), settipLengthhigher (0.3 ~ 0.5) to make the arrow more prominent.
cv.drawMarker — Drawing Markers
cv.drawMarker is used to draw various predefined marker shapes at specified positions on an image. It’s more flexible than using cv.circle for dots, supporting cross shapes, stars, diamonds, and other marker types — ideal for annotating feature points, corners, and keypoints.
Function Syntax
img = cv.drawMarker(img, position, color[, markerType[, markerSize[, thickness[, line_type]]]])Parameters
| Parameter | Description |
|---|---|
img | Input image |
position | Marker position coordinates (x, y) |
color | Color in BGR format |
markerType | (Optional) Marker type, see table below |
markerSize | (Optional) Marker size |
thickness | (Optional) Line width |
line_type | (Optional) Line type |
Supported Marker Types
| Constant | Description |
|---|---|
cv2.MARKER_CROSS | Cross shape (+) |
cv2.MARKER_TILTED_CROSS | Tilted cross shape (x) |
cv2.MARKER_STAR | Star shape (*, combination of cross + tilted cross) |
cv2.MARKER_DIAMOND | Diamond |
cv2.MARKER_SQUARE | Square |
cv2.MARKER_TRIANGLE_UP | Upward triangle |
cv2.MARKER_TRIANGLE_DOWN | Downward triangle |
Code Example
import cv2
import matplotlib.pyplot as plt

img = cv2.imread('MakerOnsite-Logo.png')

# Draw different marker types at four corners of the image
# Star marker
img = cv2.drawMarker(img, (50, 50), (0, 255, 255),
                     markerType=cv2.MARKER_STAR, markerSize=20, thickness=3)
# Diamond marker
img = cv2.drawMarker(img, (50, 450), (0, 255, 255),
                     markerType=cv2.MARKER_DIAMOND, markerSize=20, thickness=3)
# Cross marker
img = cv2.drawMarker(img, (450, 450), (0, 255, 255),
                     markerType=cv2.MARKER_CROSS, markerSize=20, thickness=3)
# Tilted cross marker (X shape)
img = cv2.drawMarker(img, (450, 50), (0, 255, 255),
                     markerType=cv2.MARKER_TILTED_CROSS, markerSize=20, thickness=3)

plt.imshow(img)
plt.axis('off')
plt.show()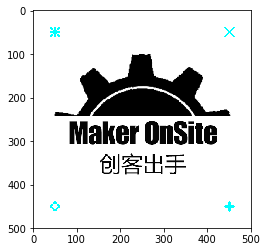
cv.putText — Drawing Text
Adding text annotations to images is a common need for debugging and presenting results. cv.putText can conveniently add English text, but it does not support Chinese characters. For Chinese text, you’ll need to use the PIL library as an alternative.
Drawing English Text
Function Syntax
img = cv.putText(img, text, org, fontFace, fontScale, color[, thickness[, lineType[, bottomLeftOrigin]]])Parameters
| Parameter | Description |
|---|---|
img | Input image |
text | The English text string to draw |
org | Text coordinates in the image, corresponding to the bottom-left corner of the text |
fontFace | Font type, e.g., cv2.FONT_HERSHEY_SIMPLEX |
fontScale | Font scale factor, multiplied by the font’s base size |
color | Text color in BGR format |
thickness | (Optional) Text stroke thickness |
lineType | (Optional) Line type |
bottomLeftOrigin | (Optional) If True, the coordinate origin is at the bottom-left; otherwise at the top-left |
Available Font Types
cv2.FONT_HERSHEY_SIMPLEX— Regular sans-serif fontcv2.FONT_HERSHEY_PLAIN— Small sans-serif fontcv2.FONT_HERSHEY_DUPLEX— Regular sans-serif font (bolder)cv2.FONT_HERSHEY_COMPLEX— Serif fontcv2.FONT_HERSHEY_TRIPLEX— Serif font (bolder)cv2.FONT_HERSHEY_SCRIPT_SIMPLEX— Script/handwriting fontcv2.FONT_HERSHEY_SCRIPT_COMPLEX— Script/handwriting font (bolder)- Add
cv2.FONT_ITALICto any of the above for italic style
Code Example
import cv2
import matplotlib.pyplot as plt

img = cv2.imread('MakerOnsite-Logo.png')

# Add English text to the image
img = cv2.putText(img, "Hello Maker!", (50, 80),
                  cv2.FONT_HERSHEY_SIMPLEX, 2, (200, 100, 90), 5)

plt.imshow(img)
plt.axis('off')
plt.show()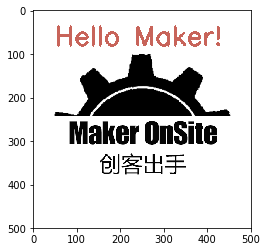
Drawing Chinese Text (Using PIL)
cv.putText only supports ASCII characters and cannot render Chinese. The solution is to use the PIL (Pillow) library. The core idea is: convert the OpenCV numpy array image to a PIL Image object, draw text using PIL, then convert back to a numpy array.
Code Example
import cv2
import numpy as np
import matplotlib.pyplot as plt
from PIL import Image, ImageDraw, ImageFont

img = cv2.imread('MakerOnsite-Logo.png')

# Check if it's an OpenCV image type (numpy.ndarray)
if isinstance(img, np.ndarray):
    # Convert OpenCV image (BGR) to PIL Image (RGB)
    img = Image.fromarray(cv2.cvtColor(img, cv2.COLOR_BGR2RGB))
    # Create a drawing object
    draw = ImageDraw.Draw(img)

    # Load a font file (make sure the font file exists)
    # simsun.ttc is a SimSun font file; you can replace it with any Chinese font on your system
    fontText = ImageFont.truetype("simsun.ttc", 66, encoding="utf-8")

    # Draw Chinese text on the image
    draw.text((100, 40), '创客出手!', (255, 100, 200), font=fontText)

    # Convert back to a numpy array that OpenCV can work with
    img = np.asarray(img)

plt.imshow(img)
plt.axis('off')
plt.show()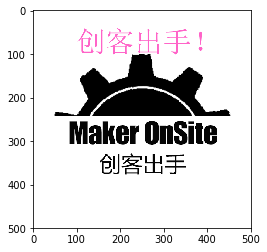
Notes:
- Make sure the Chinese font file (e.g.,
simsun.ttc) exists in your working directory. On Linux, fonts are typically found under/usr/share/fonts/; on macOS, you can use fonts from/System/Library/Fonts/.- In PIL, colors are in RGB format, which differs from OpenCV’s BGR format. Pay attention to the color channel order when converting.
- After drawing, convert back to
numpy.ndarrayto continue using other OpenCV functions or running deep learning inference.
Complete Combined Example
Below is a comprehensive example that combines all drawing functions on a single image, helping you visually see the effect of each function:
import cv2
import numpy as np
import matplotlib.pyplot as plt

# Create a 500x500 black canvas
img = np.zeros((500, 500, 3), dtype=np.uint8)

# 1. Draw a line: green diagonal
img = cv2.line(img, (50, 50), (450, 450), (0, 255, 0), 3)

# 2. Draw a rectangle: blue border
img = cv2.rectangle(img, (100, 100), (400, 400), (255, 0, 0), 2)

# 3. Draw a filled circle: red dot
img = cv2.circle(img, (250, 250), 50, (0, 0, 255), -1)

# 4. Draw an ellipse: yellow ellipse
img = cv2.ellipse(img, (250, 250), (120, 60), 45, 0, 360, (0, 255, 255), 2)

# 5. Draw a polygon: white triangle
triangle_pts = np.array([[250, 50], [100, 350], [400, 350]])
img = cv2.polylines(img, np.int32([triangle_pts]), True, (255, 255, 255), 2)

# 6. Fill a convex polygon: semi-transparent purple pentagon (draw on a copy then blend)
overlay = img.copy()
poly_pts = np.array([[350, 50], [450, 100], [430, 200], [370, 200], [320, 100]])
cv2.fillConvexPoly(overlay, poly_pts, (200, 0, 200))
img = cv2.addWeighted(overlay, 0.5, img, 0.5, 0)

# 7. Draw an arrowed line: orange arrow
img = cv2.arrowedLine(img, (50, 450), (200, 300), (0, 165, 255), 2, tipLength=0.15)

# 8. Draw markers: add different marker types at multiple positions
img = cv2.drawMarker(img, (50, 50), (255, 255, 0),
                     markerType=cv2.MARKER_STAR, markerSize=20, thickness=2)
img = cv2.drawMarker(img, (450, 450), (255, 255, 0),
                     markerType=cv2.MARKER_CROSS, markerSize=20, thickness=2)

# 9. Draw English text
img = cv2.putText(img, "OpenCV Drawing", (120, 490),
                  cv2.FONT_HERSHEY_SIMPLEX, 0.8, (255, 255, 255), 2)

# Display the result
plt.imshow(cv2.cvtColor(img, cv2.COLOR_BGR2RGB))
plt.axis('off')
plt.title("OpenCV Drawing Functions Combined")
plt.show()
This combined example covers nearly all commonly used drawing functions. You can run this code directly to observe the effects, then modify parameters as needed.
Parameter Reference Table
The table below summarizes the key parameters of all drawing functions for quick reference:
| Function | Key Parameters | Special Notes |
|---|---|---|
cv.line | pt1, pt2, color, thickness | Most basic line drawing |
cv.rectangle | pt1(top-left), pt2(bottom-right), color, thickness | thickness=-1 for filled rectangle |
cv.circle | center, radius, color, thickness | thickness=-1 for filled circle |
cv.ellipse | center, axes, angle, startAngle, endAngle | axes are half-axis lengths; angles in degrees |
cv.polylines | pts, isClosed, color, thickness | pts must be an int32 array |
cv.fillConvexPoly | points, color | Convex polygons only |
cv.arrowedLine | pt1, pt2, color, thickness, tipLength | tipLength controls arrow size |
cv.drawMarker | position, color, markerType, markerSize | Multiple marker types available |
cv.putText | text, org, fontFace, fontScale, color | English only; use PIL for Chinese |
FAQ & Tips
1. Color Format: BGR, Not RGB
This is the most common pitfall for OpenCV beginners. OpenCV uses BGR (Blue-Green-Red) order, not RGB.
# Red — note the third channel is 255
red = (0, 0, 255)

# Green
green = (0, 255, 0)

# Blue
blue = (255, 0, 0)
If the colors you draw don’t match your expectations, first check whether you’ve mixed up BGR and RGB.
2. Meaning of the thickness Parameter
thickness > 0: Draws an outline, where the value is the line width in pixelsthickness = -1: Draws a filled shape (applies torectangle,circle,ellipse)
For cv.polylines and cv.line, thickness = -1 won’t raise an error but also won’t produce a fill effect. Use cv.fillConvexPoly or cv.fillPoly for filled polygons.
3. Three Choices for lineType
| Constant | Description | Recommended Use Case |
|---|---|---|
cv2.LINE_4 | 4-connected line | Fastest, but visible aliasing |
cv2.LINE_8 | 8-connected line (default) | Balance of speed and quality |
cv2.LINE_AA | Anti-aliased line | Best quality, ideal for smooth curves |
If you have high quality requirements for drawing (e.g., circles or ellipses), it’s recommended to use cv2.LINE_AA anti-aliasing for much better results:
img = cv2.circle(img, (250, 250), 100, (0, 255, 0), 2, cv2.LINE_AA)4. Purpose of the shift Parameter
The shift parameter is used for sub-pixel precision drawing. When shift = n, the coordinate values you provide are divided by 2^n. For example, with shift=2, coordinates (200, 200) actually represent (50, 50). This is very useful when you need high-precision drawing, such as sub-pixel level feature point annotation.
5. All Drawing Functions Modify the Original Image
All OpenCV drawing functions operate in-place, directly modifying the input numpy array. If you need to draw on a copy without affecting the original, make a copy first:
img_copy = img.copy()
cv2.rectangle(img_copy, (50, 50), (200, 200), (0, 255, 0), 2)
# img remains unchanged, img_copy is modified
6. Displaying Images in Jupyter Notebook
When displaying OpenCV images in Jupyter, it’s recommended to wrap a helper function to handle BGR-to-RGB conversion:
def show_img(img):
    """Correctly display OpenCV images in Jupyter Notebook"""
    plt.imshow(cv2.cvtColor(img, cv2.COLOR_BGR2RGB))
    plt.axis('off')
    plt.show()
Summary
This article has systematically introduced OpenCV Python’s 2D drawing functions, from the most basic cv.line to the feature-rich cv.ellipse and cv.polylines, through to text rendering and Chinese character support. Let’s review the core content we’ve covered:
- Basic Shapes:
cv.line(lines),cv.rectangle(rectangles),cv.circle(circles/dots) are the three most commonly used drawing functions - Advanced Shapes:
cv.ellipse(ellipses/arcs),cv.polylines(polygon outlines),cv.fillConvexPoly(convex polygon filling) - Markers & Arrows:
cv.drawMarker(multiple marker types),cv.arrowedLine(arrowed line segments) - Text Rendering:
cv.putTextfor English text, PIL +ImageDrawfor Chinese text - Key Parameters: Colors use BGR format,
thickness=-1means filled,lineTypecan be set to anti-aliased
These drawing functions have wide applications in object detection visualization, image annotation, debug information overlay, UI prototyping, and more. Once you’ve mastered them, you can freely add visual elements at any stage of your image processing pipeline.
I recommend saving the combined example code as a template for future drawing tasks. When you have specific requirements, just modify the corresponding parameters.
For more details, refer to the OpenCV Official Drawing Module Documentation.